
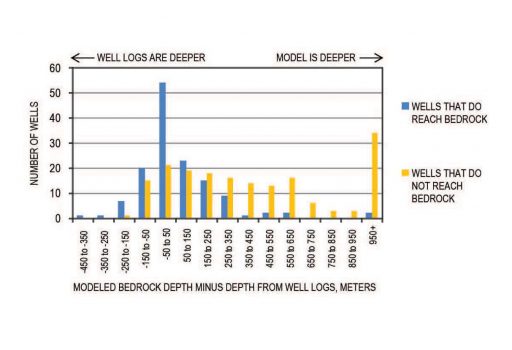
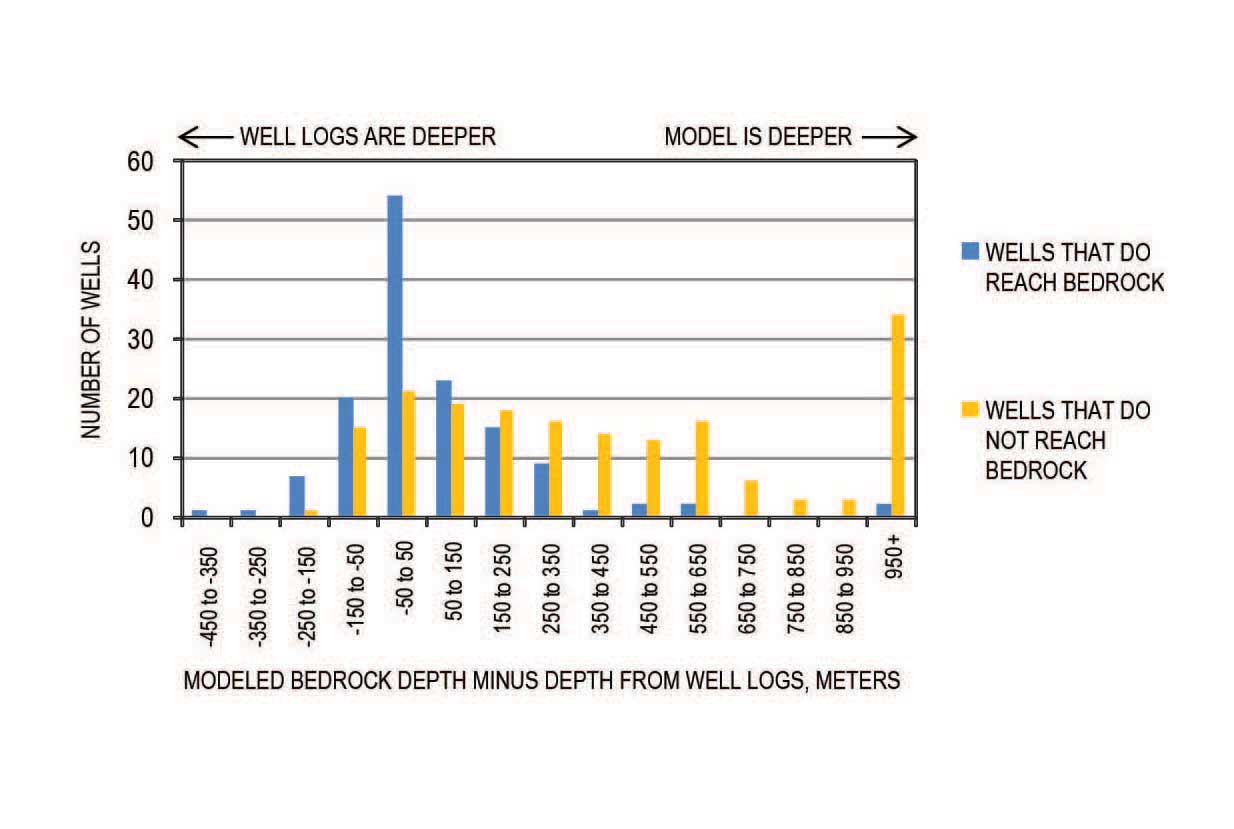
Title of graphic: Histogram Chart of Depth to Bedrock and Well Depth in relation to a Gravity Geophysical Model
of the Subsurface Bed Rock, NW Arizona
Type of graphic: Illustration for a scientific publication
Client: Arizona Department of Water Resources, Mohave County Water Commissioners, City of Kingman, General Public
Communication objective: To illustrate the histogram of the difference in bedrock depth between the basin geometry model and well logs. Each point that forms the histogram population is calculated by subtracting well-log depth from model depth. Negative values indicate that modeled depths are below bedrock surface in well logs.
Type of content provided: Geophysical Gravity Model, Water-Level Measurements, sub-surface geology
Software used: Microsoft Excel